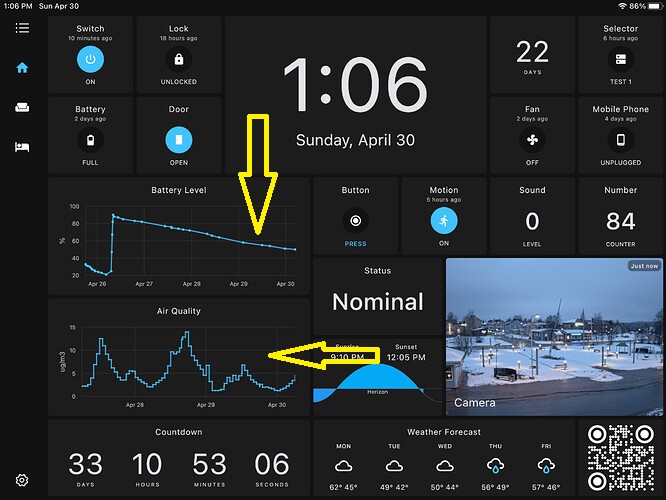
how can o do this ? the 2 arrow on the foto ?
i want to put 2 temp sensor like that graph. 
@Florin_Trica Those are History widget for Home Assistant in the next-gen dashboard, available only on iOS Preview right now. Next-gen dashboards are planned for Android later this year.
If I remember correctly, you are using Domoticz right now? Chart widgets are not available for Domoticz yet, even in the next-gen dashboards, but it is something I want to add, depending on what data Domoticz API provides.
yes, I use domoticz. we could use some improvements
we are waiting for the new updates
Thx
domoticz history data is easy to get via restful api. From a forum post:
    "You can get the historic values of the Electricity device using the API:"

  You can get the historic values of the Electricity device using the API:From:  https://www.domoticz.com/forum/viewtopic.php?t=33030#
    http://[domoticz IP]: domoticz port>/json.htm?type=graph&sensor=counter&idx=<device idx>&range=day
    This will give you the history data with a granularity of 5 minutes.
For example, I get 1 day of historical data on a temp/humiidity sensor at index 618 by:
http://[server]:8080/json.htm?type=graph&sensor=temp&idx=618&range=day
range can be day, month, or year
example values (partial):
{
"result" :
[
	{
		"d" : "2023-08-26 12:25",
		"hu" : "48",
		"te" : 74.299999999999997
	},
	{
		"d" : "2023-08-26 12:30",
		"hu" : "48",
		"te" : 74.299999999999997
	},
	{
		"d" : "2023-08-26 12:35",
		"hu" : "48",
		"te" : 74.299999999999997
	},
	{
		"d" : "2023-08-26 12:40",
		"hu" : "48",
		"te" : 74.299999999999997
	},
.
.
.
	{
		"d" : "2023-08-26 12:45",
		"hu" : "47",
		"te" : 72.5
	},

	{
		"d" : "2023-08-27 12:25",
		"hu" : "52",
		"te" : 75.200000000000003
	}
],
"status" : "OK",
"title" : "Graph temp day"
}What about Openhab, such kind of widget will available for this platform?
I am interest too for OpenHab
@Slawomir_Ksiazek @hooh1967h Yes, next-gen dashboards do support line chart widget for Number items with OpenHAB.