Open history graph when clicking on a sensor

It would be REALLY great and add a lot of usability if clicking a sensor would open the “history screen” like it does in HA.

Like tipping on that sensor:

image

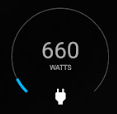
would open a new screen like that one:

image

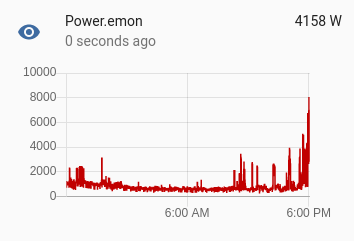
Sometimes knowing the history of a sensor is very valueable and sometimes even better then the momentary value it shows.

Yes! Good idea, but I would like to choose:

  1. show the graph
  2. turn on / off the switch
1 Like

I wasn’t talking about SWITCHES anyway, but SENSORS. A switch should be ON/OFF by default anywhere. It may be interesting to know when it was switched in the past, sure. But imho the requested feature makes most sense for sensors.

1 Like

Good idea, It’s really helpful to track on daily / 24hrs status for every entities.

+1 for this.

Id like to see this as well.

This would be a really nice feature. A nice to have, rather than core need, but I’d certainly use it.

OpenHAB, if setup with Grafana, can server up image versions of charts… So maybe even a way to set an image URL on a widget like a sensor… So that if you tap the sensor the image (chart) pops up much like the security cameras work?

@Igor this could possibly be better logged as a separate idea?

@TommySharp wouldn’t this already work with Camera widget?

@igor But I don’t think you can have a “Value” widget that when clicked opens a web image like the camera?

@TommySharp ah, I see what you mean. I misread the post.

Updating my status on this from ‘nice to have’ to ‘would be a key part of my home automation’. :wink:

Im starting to setup automations to turn on fans when certain rooms are too hot, and being able to see the last 24 hours helps me to see the temperature pattern of each room. It will also be really useful to see the affect of turning on the fans.

For now I have had to add a web widget hidden away on the last page (because its ugly) with the lovelace history graph. Nasty but it works. would be so much nicer to have something baked into HomeHabit, and the popup on a sensor widget sounds like the best design.

I use HomeAssistant so and investigating if there is any way to server up a Home Assistant chart in the webview widget.

+1 for this feature !!!

Other thing that would be great on the same way is the hability to show a tendancy arrow on the sensor widget. For exemple I show pH and redox of my pool on a dashboard. The value is necessary but to determine if I should add some chemical products in my pool I rely not only on the value itself but on the tendancy too.