
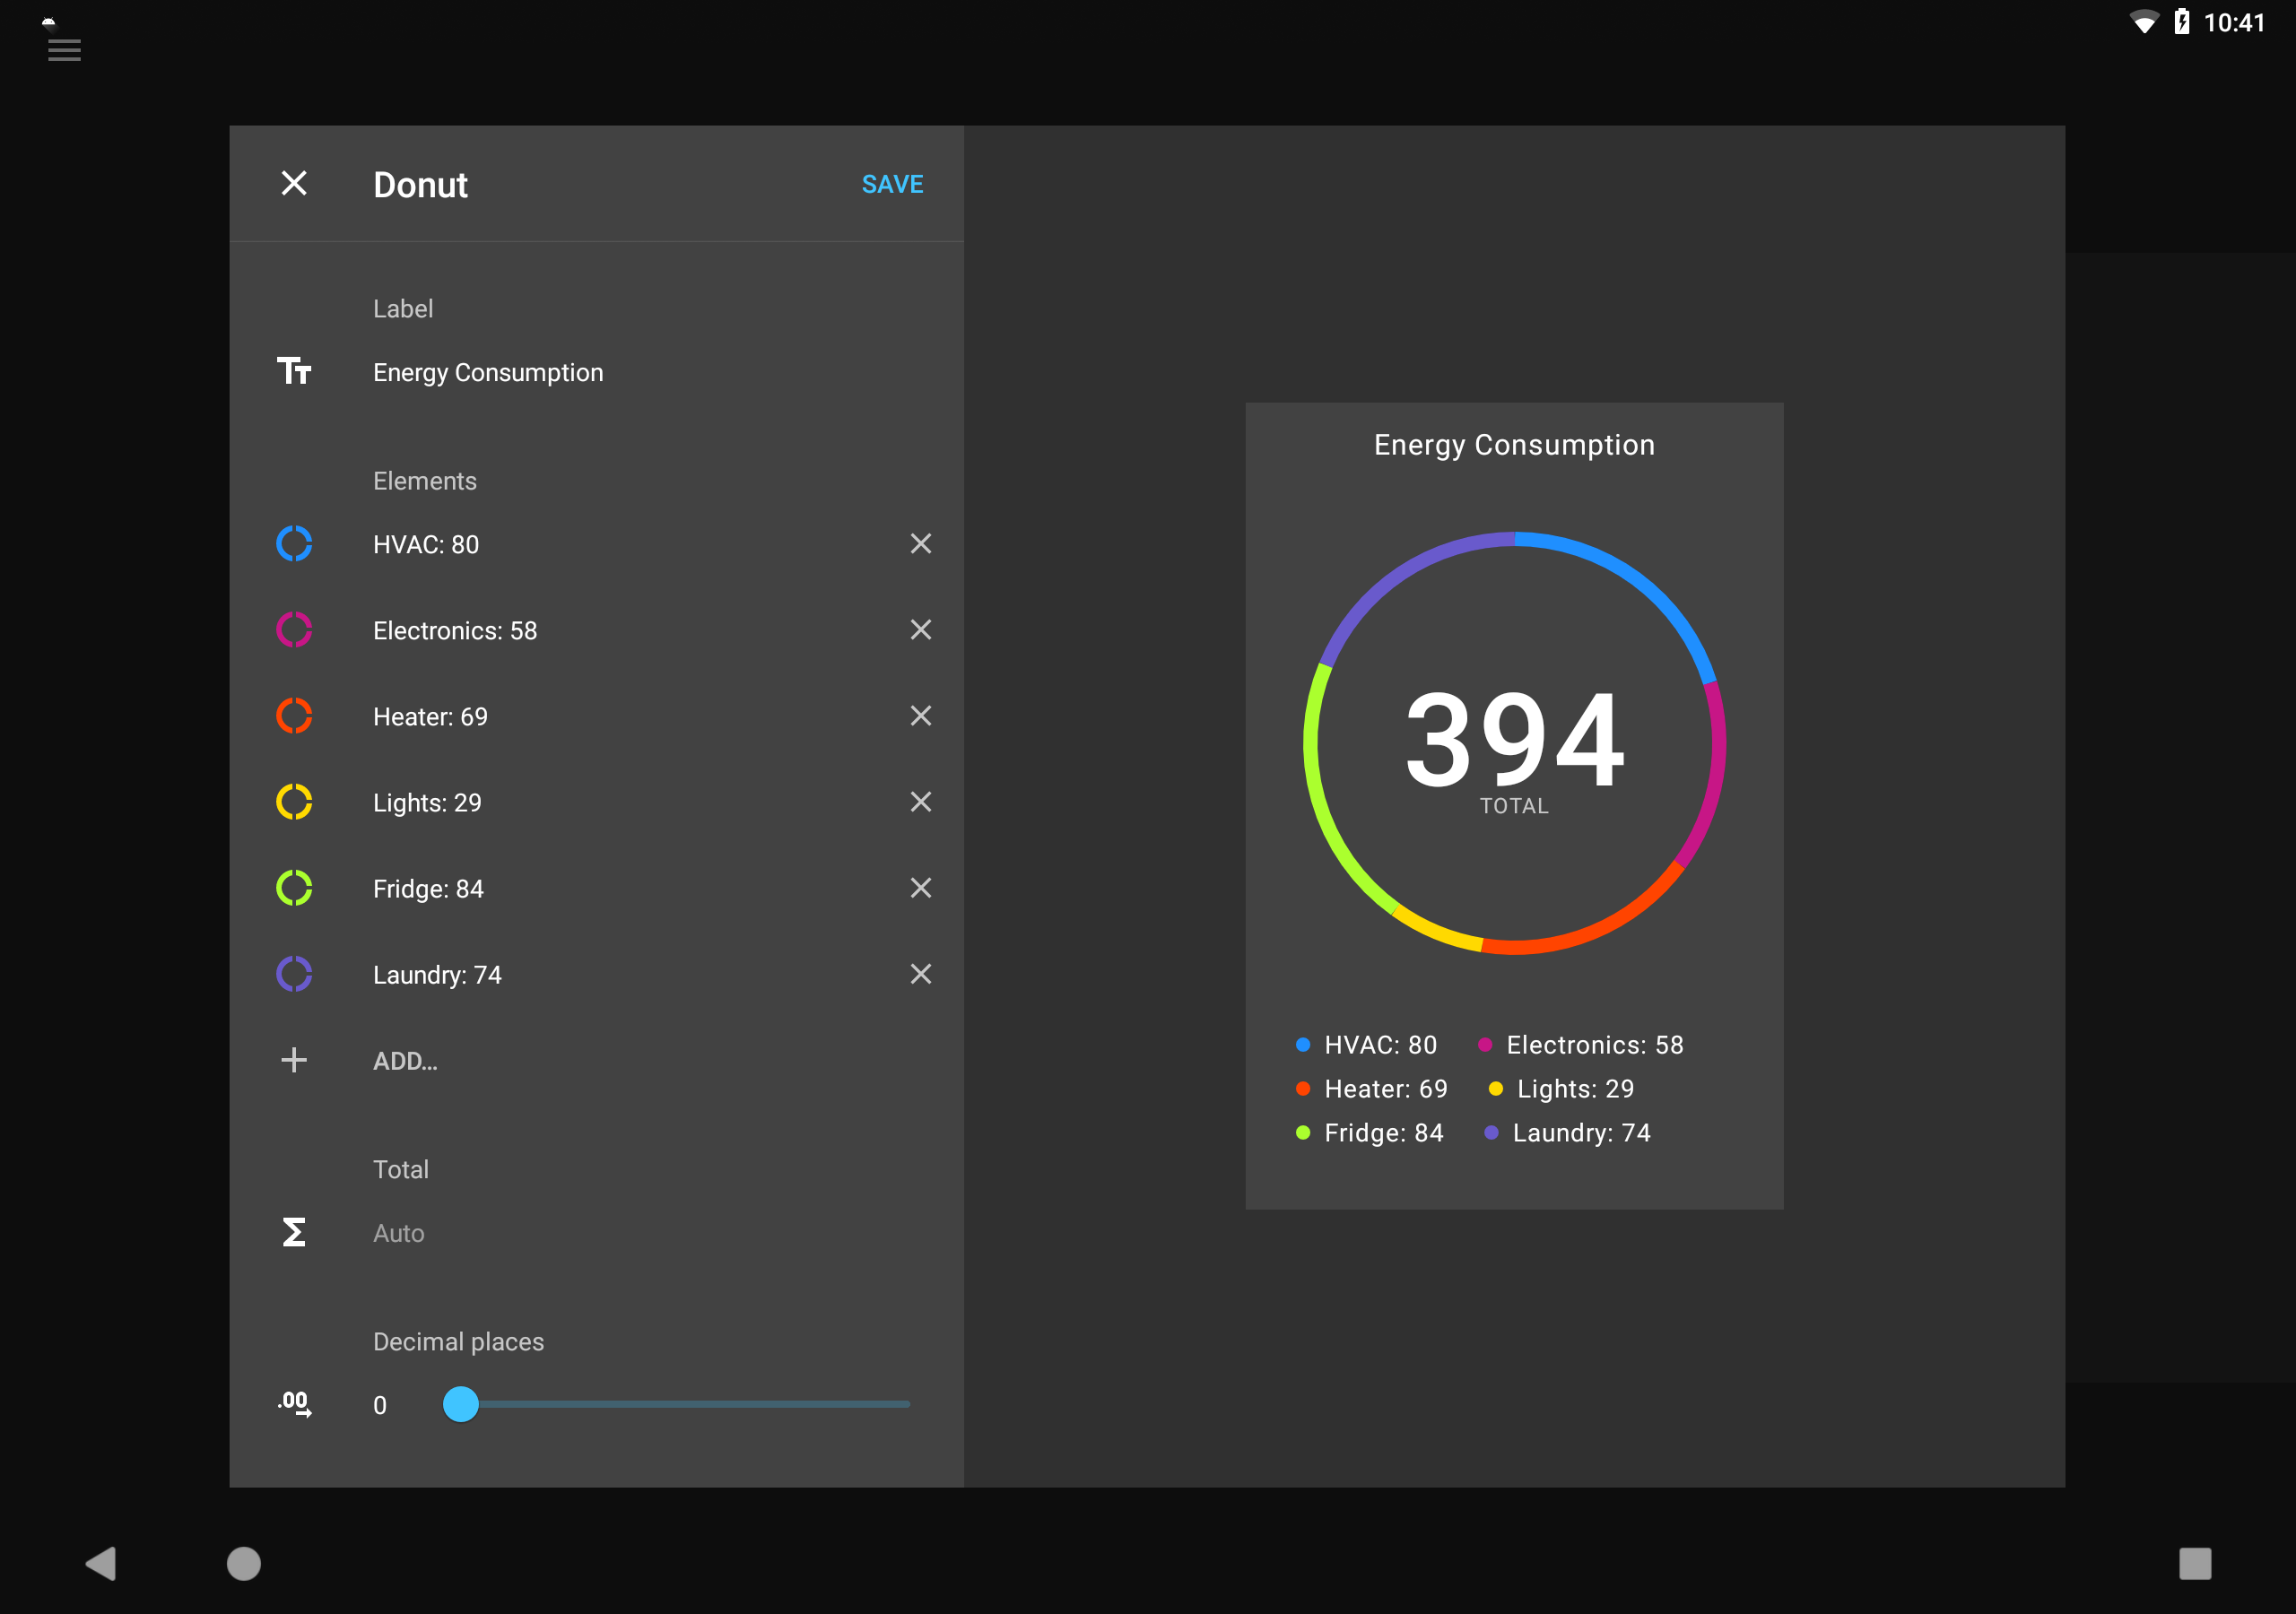
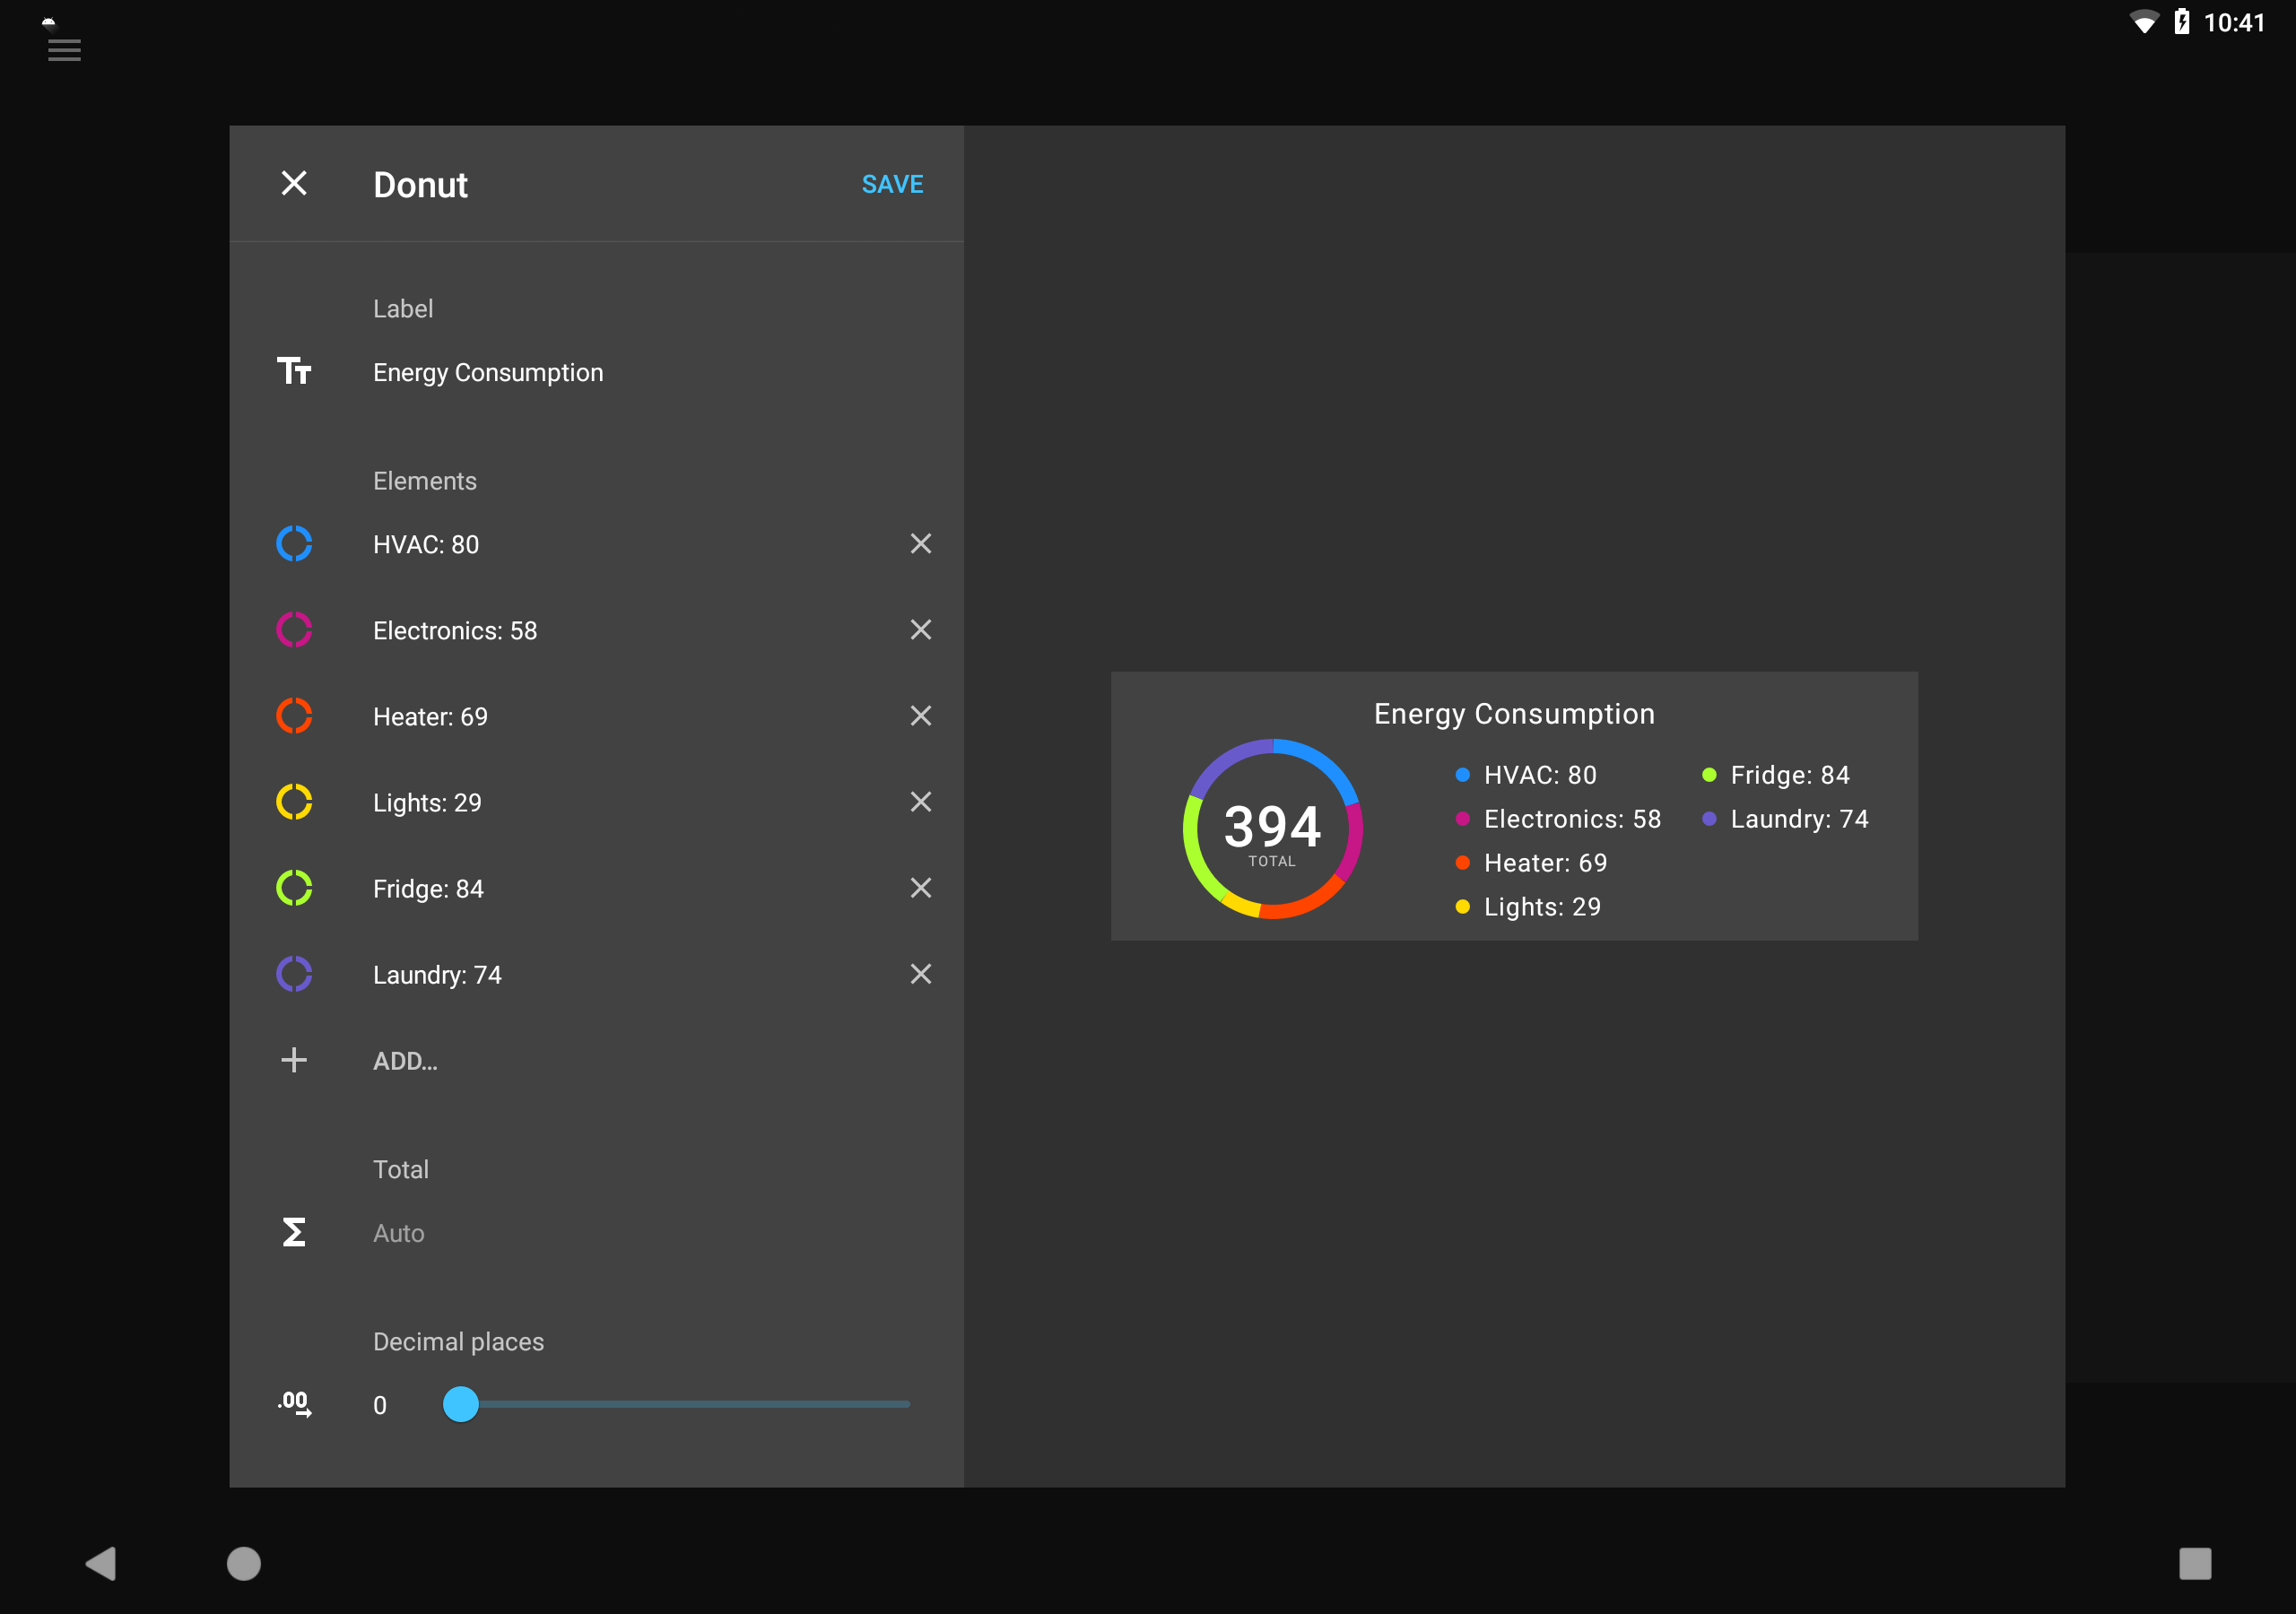
Donut chart
The new donut chart widget that allows to quickly show data distribution in a single widget. It is great for displaying home energy consumption and other relative data.
The widget is available in various sizes and layouts to make the best use of dashboard space.
Camera streaming V2 (Labs)
The new HomeHabit Labs feature - Camera streaming V2 provides alternative and improved video stream processing. That should better supporting popular camera streaming formats such as MJPEG and RTSP, and help resolve issues that some users experienced. It also provides better performance on less powerful devices.
Additionally, it adds support for HTTP Live Streaming protocol, that is used by streaming component from Home Assistant in particular.
This is still an in-progress feature, so it might still have some quirks. Please try this out and report any issues.
HomeHabit 10.0
Available starting June 6, 2021