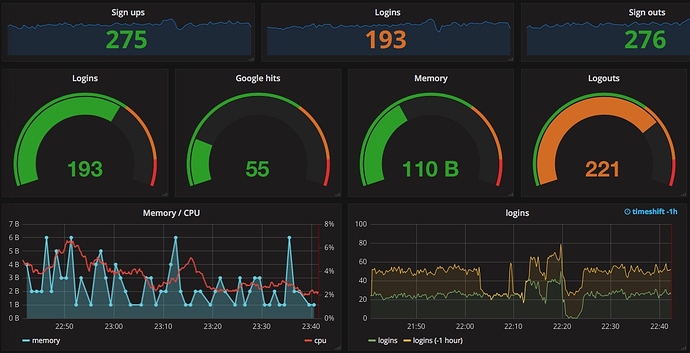
Are there any plans to implement graphs? Currenly there’s only the linear gauge option, but for example to show power usage in watts over the past hour, it’d be great to have grafana-like graphs:
Only workaround is convert charts from grafana to jpg
I’ve used history graph from home assistant displayed through the home habit web url widget, with a dark theme. It’s ugly but means I can at least see my temperature sensors over last 24 hours on a page hidden at the end.

 I’ll play around with them.