I’ve been using HomeHabit for some time and really like it and now an idea poped up.
Why not show electricity prices!?!?
Let me explain and then see what you think about it…
Tibber is a company selling electricity in Sweden, Norway and Germany. The concept with spot price is good but you need to be aware of the prices to be able to save money.
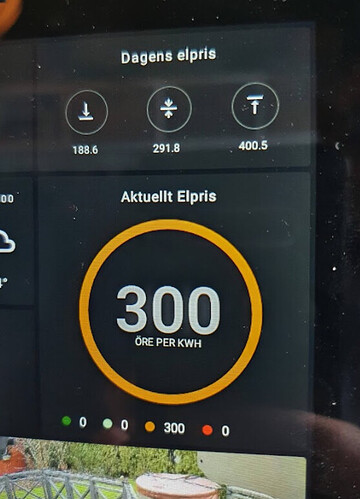
There app is good and accessible for the interested once in a family. I will never get my son or daughter to check it. A visualization is needed. I run domoticz and import data from Tibber and convert it to fit homehabit donut.
I also control a RGB LED and indicating the same colours as the donut ring. I am not able to show the full 24h graph on the tablet and the tibber app is not great on a tablet. I would like to have the full overview available for everyone.
There are many companies in Europe having the same concept. All the customers have the same need of displaying price data.
This is why I write this post!
I see a golden opportunity for HomeHabit to be the app to be used on an old tablet or phone mounted to the wall to show electricity price data.
Since you have decided to do quite some new integrations it logical we will have an integration towards nordpool (electricity spot market trade site). It covers many countries and everyone signed up with Tibber(and others) have the same prices.
The people interested in electicity prices will for sure start using HomeHabit. They will also add the weather integrations to look at sun wind and rain forecasts. Lots of sun, rain and wind will end up in lower price tomorrow 
HomeHabit will then be attractive also for users not owning a “smart home server”.
Defined user case:
AS: a customer buying electricity to spot market prices
I WANT: to visualize todays (and tomorrows) electricity prices on a wall tablet. Show hour by hour and also highlight the price for current hour together with Min, Avg and Max prices for today…
SO: that the family/consumers can plan when to consume large amount of electricity like taking showers, washing clothes etc
VALUE: We will save money and buy more wall tablets + Homehabit licences 
Some suggestions…
-
Prices = Cost per kWh, For Sweden SEK = selectable if kr or öre (1,5kr = 150 öre)
-
There should be 4 price levels:
- Low(Dark Green): Below a configurable value, for example 100öre
- Medium(Light Green): Above “Low” and lower than todays average
- High(Orange): Above todays average but below “Super high”
- Super High(Red): Above a configurable value, for example 300öre
-
Show todays price and when available also a preview of tomorrows price. Available around 13:00-15:00.
-
Screen saver can show:
Today’s electricity price
Current price: Super High(356öre), but next hour will be better(265)
Min/Avg/Max: 95/220/366 -
You will need to set:
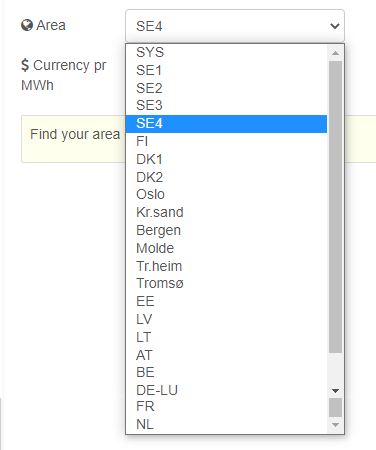
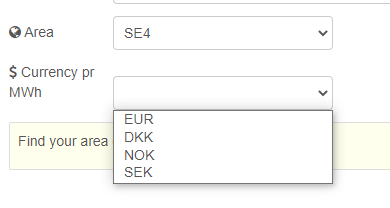
- Area

- Currency

- Something about tax, tax needs to be included in the price
- Possible to add a transfer fee. This will then be added to all prices
Here are some links:
Nordpool site: https://www.nordpoolgroup.com/
API info: https://developers.nordpoolgroup.com/
Tibber: https://developer.tibber.com/
Nordpool integration for NodeRed can be used as reference:
NodeRed Node: https://flows.nodered.org/node/node-red-contrib-nordpool-api-plus
Using this unofficial API: https://github.com/samuelmr/nordpool-node
Some pictures with explanations…
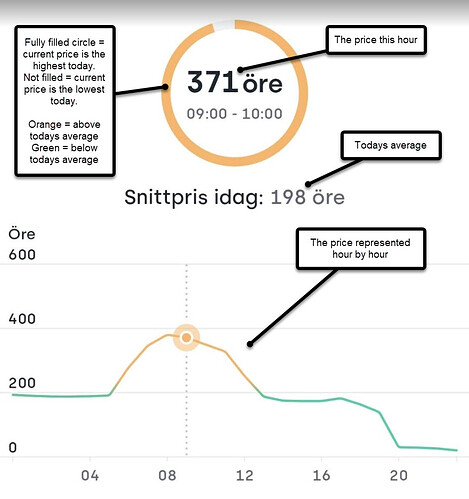
This is from the Tibber-app, I would really like to see something similar on the HomeHabit tablet:
My vizulisation in HomeHabit, not perfect but good enough for now:


