Implement the ability to display charts within the application.
At the moment I get by in the old Rotini embedding the chart images generated by OpenHAB and also Grafana.
Chart widgets that are more interactive and “natively” generated would be a good
2 Likes
This will be a killer feature but I can fully understand the complexities as HomeHabit would need to start recording historical values to be able to display charts…
Even a chart that just shows currently session data, upto 24hours would be a start. I’ve not had the need to see chart data in the home hub tablet over a day old… that’s left to more detailed backend
systems.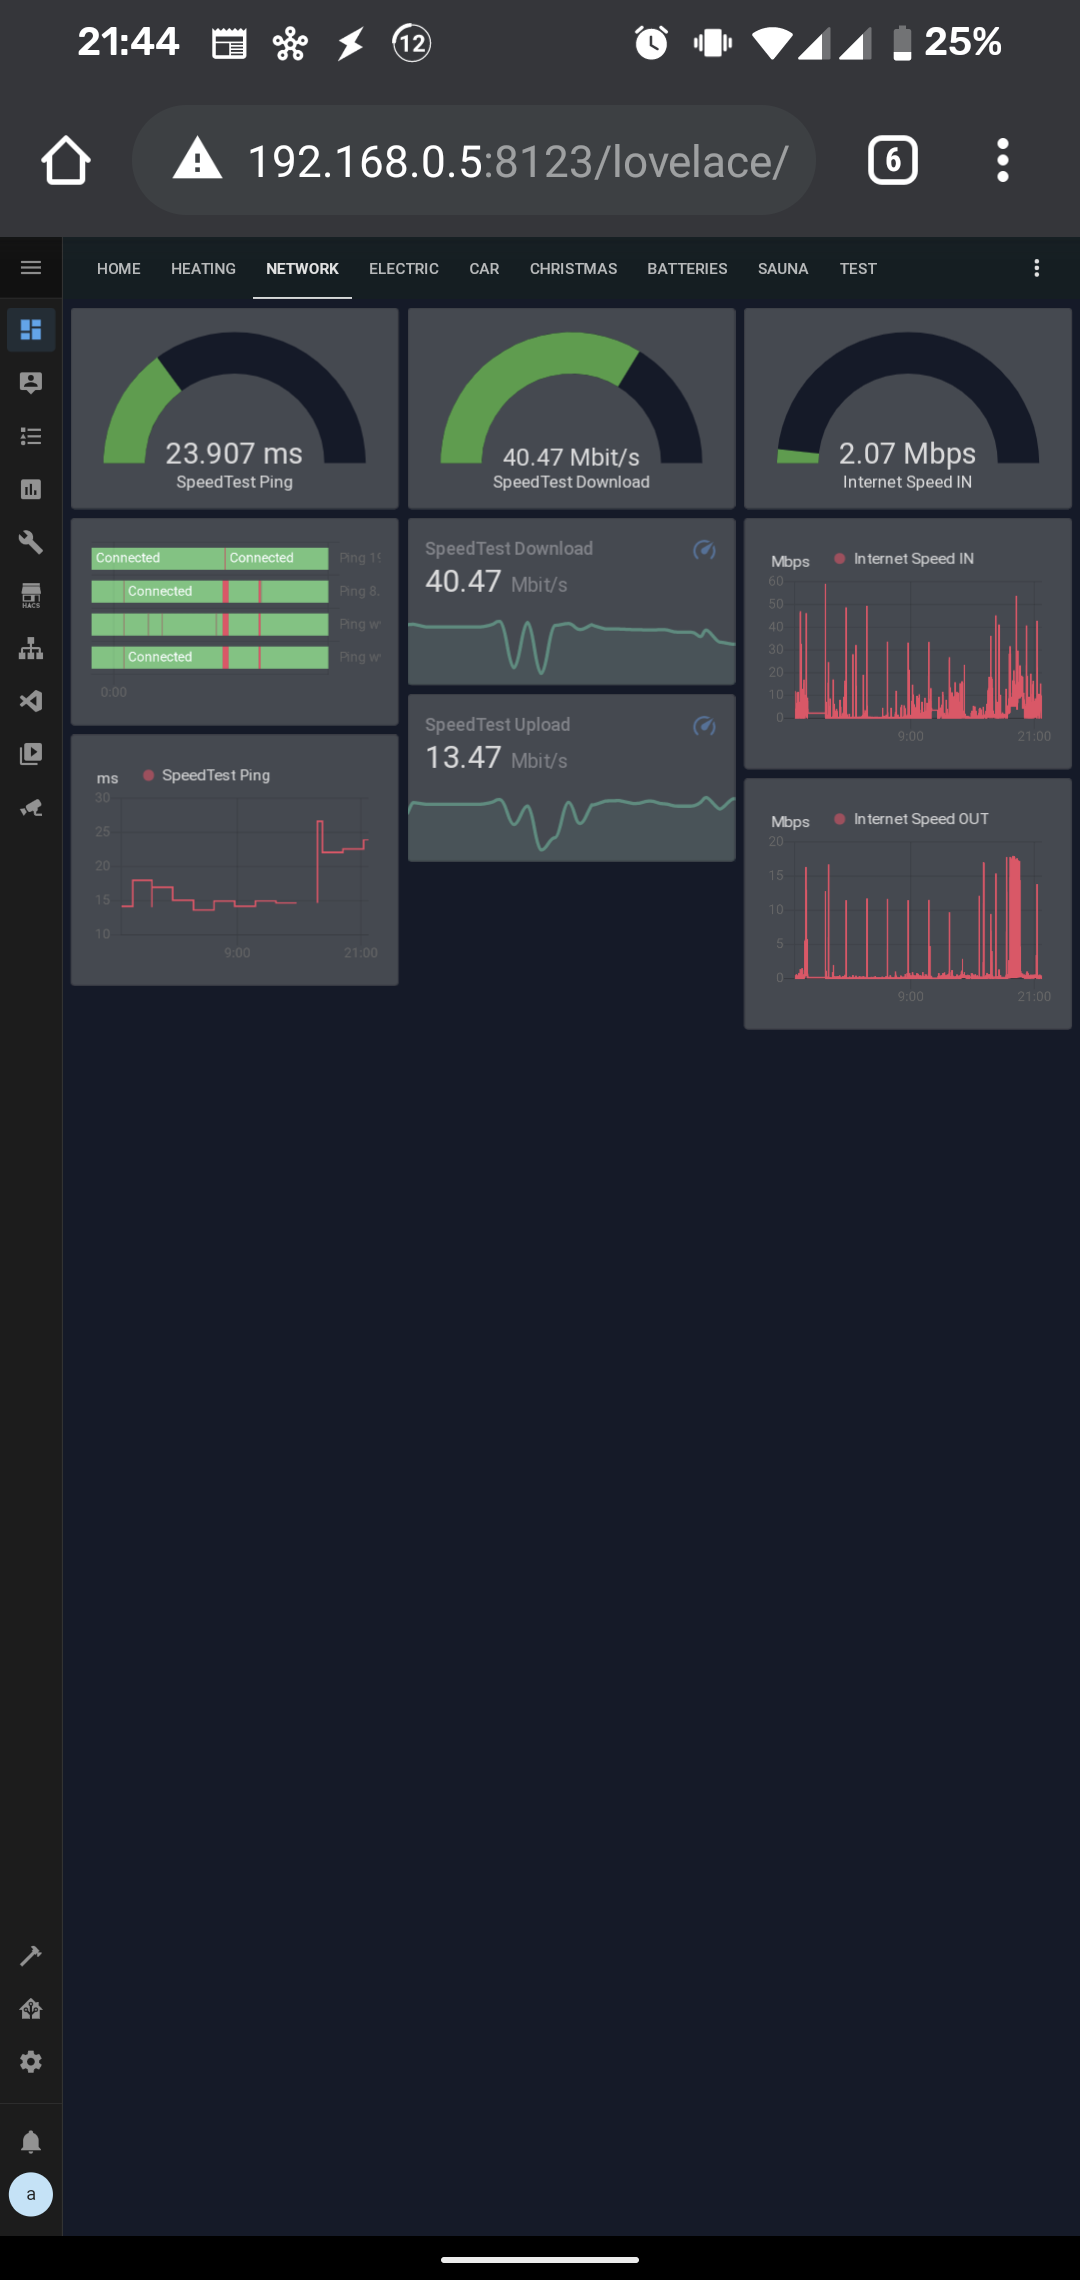
I use a Web widget to display a home assistant lovelace graph to show the last 24hours of all my temperature sensors. Not sure if home assistant serves up the historic data, but a chart widget would be cool.
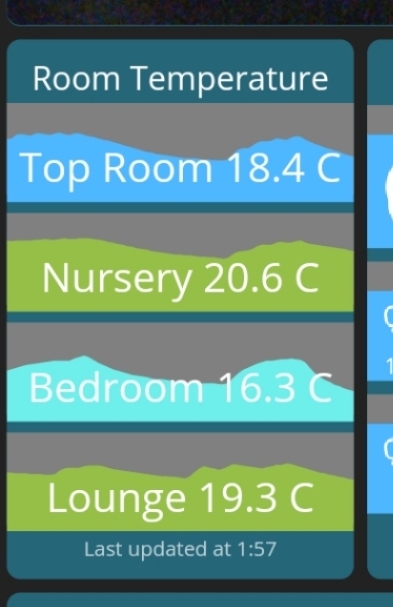
When I created my own dashboard, I actually had the background of the temperature widget be a 2 tone graph of the days temperature